Measure the performance of your collections in real time.
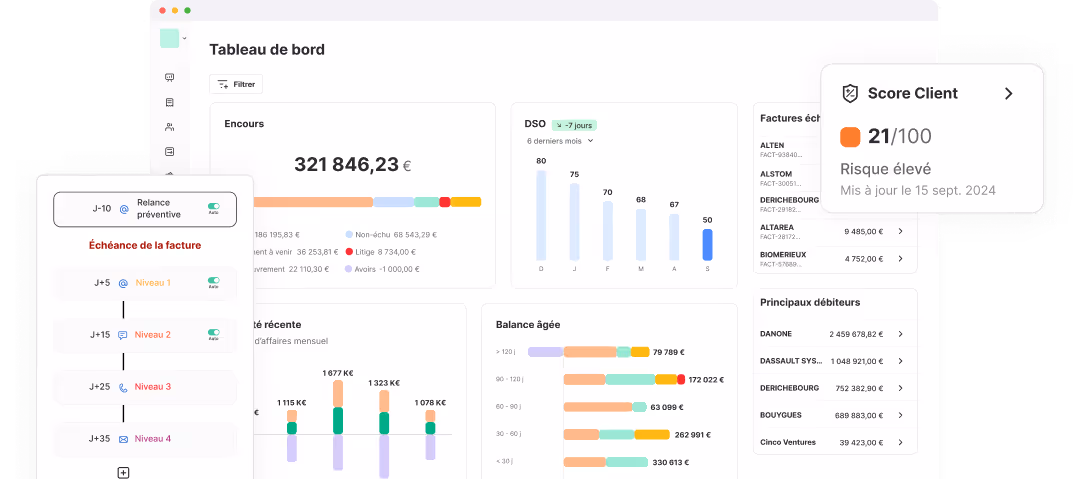
Your aging balance is automatically calculated and updated in real time. Easily navigate the different sections using period and status filters, and quickly identify at-risk customers. Use this indicator from your accounts receivable dashboard to prioritise actions and build your debt collection strategy.
Find a monthly summary of your past and upcoming payments in your accounts receivable dashboard. Cash flow forecasts cover the next three months. They are based on the customers' actual payment habits (their DSO) and include any payment promises received.
Your DSO is calculated in real time using the outstanding balance method, also known as the “count-back” method. Monitor the evolution of your DSO month by month from your accounts receivable dashboard to evaluate the effectiveness of your debt collection actions. Gain more precision in your analysis by accessing this indicator in each customer record to analyse your debtors' payment behaviour.
Analyse the composition of your outstanding amount (due, not yet due or in dispute) directly from your accounts receivable dashboard. Access your customers’ payment promises and the total amount of invoices in recovery. Filter your outstanding receivables by status to identify the customers concerned.

Customise and adapt your view to suit your organisation
Refine the visualisation of our accounts receivable dashboard using various filters configurable by customer or by invoice: sector, geographical area, company size... Define your own criteria.
Make daily work easier for your teams by defining the view of your accounts receivable dashboard based on each user's role. This can be restricted to a customer portfolio to simplify follow-up by sales or customer service teams.
The aging balance on our accounts receivable dashboard can be exported in a few clicks. Simply define the scope and the preferred format to download your data.
Find the ranking of your main debtors by outstanding amount your accounts receivable dashboard. Navigate through each associated customer record to analyse of their delay in more detail.


Go further in your analysis by leveraging customer-level data.
Our accounts receivable dashboard shows the average payment delay for each customer, based on their payments over the last three months. LeanPay uses this data to rank your customer (good payer/bad payer) in relation to your overall customer base.
Find the actual DSO of each customer our accounts receivable dashboard. The calculation is based on their payments over the past three months.
In our accounts receivable dashboard, we show you the percentage share of each customer in relation to your total turnover for the current year.

This document summarises our approach, key features, and the tangible benefits delivered to finance teams on a day-to-day basis.


SMEs
Annual turnover < 15M €
SMEs +
15M € < Annual turnover < 50M €
Mid-sized company
The most used!
50M € < Annual turnover < 100M €
Groups
Annal turnover > 100M €
SME
Pay annualy (1 month free)
Pay monthly
245 €/month
225
€/month
Or 2 695 € excl. VAT per year
Unlimited users

1 000 invoices imported/month
SME +
Pay annualy (1 month free)
Pay monthly
545 €/month
500
€/month
Or 5 995 € excl. VAT per year
Unlimited users
2 000 invoices imported/month
Mid-sized company
Pay annualy (1 month free)
Pay monthly
745 €/month
685
€/month
Or 8 195 € excl. VAT per year
Unlimited users
5 000 invoices imported/month
Groups
Paiement annuel (1 mois offert)
Paiement mensuel
545 €/mois
Personalised quote
€/mois
Soit 5 995 € HT par an
Custom-made
Custom-made

Setting up an accounts receivable strategy is necessary to secure your cash flow. Systematic follow-ups on every invoice, combined with best practices such as automation, improve collection efficiency. But to measure the impact of collections on your company’s finances, you need access to reliable, up-to-date reporting data. Here are our tips to set up reliable accounts receivable dashboard.
Ensure reliable data
To produce reporting you can depend on, it must be based on accurate data. The best way to ensure this is to reduce manual handling during data collection and processing. Whether importing or updating, direct integration between your accounts receivable dashboard and your accounting data lowers the risk of error.
Automate your dashboard updates
Keeping your accounts receivable dashboard as up to date as possible makes it much easier to analyse. Ideally, real-time updates are possible through integrations between your reporting and accounting tools. If not, don't panic! The important thing is to know what period is covered by the data you are analysing. If they are updated once a day or a week, then just take it into account in your projections.
Several indicators allow you to monitor and analyse your accounts receivable dashboard. Each one offers a different point of view on your performances. In LeanPay's dashboard, you'll find DSO, aging balance, cash flow forecasts, outstanding amount, top debtors and top invoices.
DSO (Days Sales Outstanding)
The DSO or average payment term is a fundamental indicator in the analysis of your accounts receivable dashboard. It represents the average number of days between issuing an invoice and receiving payment. A high DSO spells trouble for your cash flow, as it means a large part of your turnover is still unpaid.Your goal should be to reduce this figure and keep it low.
Aging balance
With LeanPay, you can track and analyse your aging customer balance. Integrating this indicator into your accounts receivable dashboard will facilitate the prioritisation of your receivables actions. The aged balance sorts unpaid invoices by how long they’ve been overdue, showing the amount and delay. This lets you identify which to chase first and bring your DSO down faster.
Cash flow forecasts
Cash flow forecasts help you anticipate future cash flow. In LeanPay, they are calculated based on the average payment time over the last three months. The goal here is to have an estimate based on the reality of your customer's payments and not on a due date. This gives you realistic estimates for more informed decision-making.
Outstanding amount
In our accounts receivable dashboard, we offer you an interactive outstanding amount. You can see amounts broken down by status (not due, overdue, in dispute, in litigation, credit notes, etc.) and by client.
Top debtors and top invoices
The top debtors correspond to the 6 companies with the highest outstanding amount. The top invoices are the six overdue invoices with the highest value. These two indicators can be found in our accounts receivable dashboard and allows you to prioritise your reminders.
To measure the overall impact of your collection efforts, we recommend starting from a baseline and reviewing progress after a few months. You’ll see impact across three areas:
Compare these indicators over a specific period (monthly, quarterly, annually) with and without collection actions to assess their actual impact. You can also segment by client type, industry or other relevant criteria to identify where your actions were most effective.

LeanPay provides finance teams with an accounts receivable software to eliminate late payments and collect 100% of their revenue.
💚 Build with pride and passion in Lille, France.